Home > Resources > Knowledge Base >


0
- No products in the cart.
0
- No products in the cart.
0
- No products in the cart.
How can I avoid taking measurements when the monitored equipment is not active?
How can I avoid taking measurements when the monitored equipment is not active?
For software versions up to 1.6.3
You can set a threshold level for the Vibration Sensor to avoid the creating of useless data. The threshold can be set in the ‘Vibration Download’ section.
NOTE: the set threshold level does not apply for manually recorded measurements with the REC button.
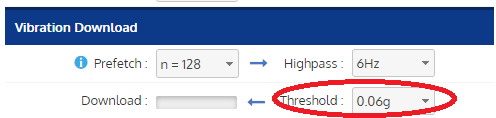
After a measurement is completed by the sensor, a few samples (‘Prefetch’ number in the figure above) will be downloaded from the sensor and the RMS value of these samples will be calculated. When the measured RMS is higher than the threshold, the full measurement is processed and stored in the OPC database. Otherwise the sample measurement is dropped.
For software versions from 1.6.3
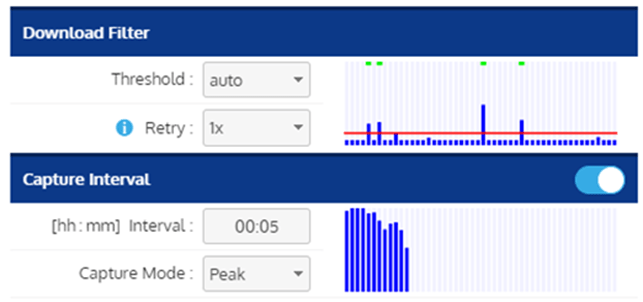
You can set a threshold level for the Vibration Sensors, the Piezoelectric Accelerometers and the Current Clamps to avoid the creating of useless data. The threshold can be set in the ‘Download Filter’ section.
NOTE: the set threshold level does not apply for manually recorded measurements with the REC button.

Remark: if the sensor acquires data on multiple measurement axes, each measurement on a measurement axis will be considered as a separate complete measurement for the threshold functionality. In this section, the notation “a complete measurement” thus refers to a full measurement on 1 axis.
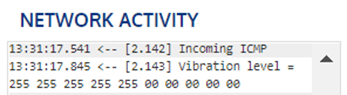
Every time the sensor acquires a measurement, the complete measurement (1 measurement axis) will be stored in sensor memory and the peak power level of this measurement will be calculated. The peak power level value will be transferred wirelessly and saved on to the iQunet Server. The transfer of this peak power level can be seen in the network activity pane (see figure below). There will thus be one value transfer per measurement axis.
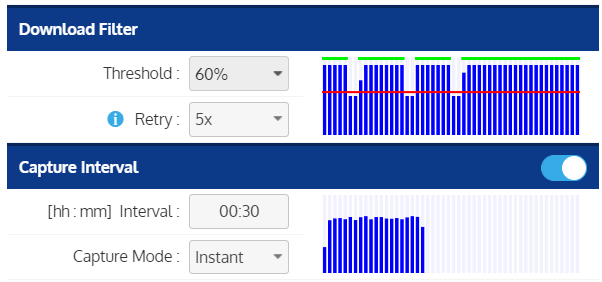
The histogram graph (see figure above) shows the peak power measured in the sensor over time. The graph shows the peak power levels of the latest 50 measurements as a blue bar on a logarithmic scale with the bar of the newest measurement on the left and the bar of the oldest on the right.
In short, each blue bar represents a reduced but complete pre-download of a historical sensor measurement (previous data capture) whereby reduced refers to the fact that only the peak power level is sent to the iQunet Server and not the full measurement, and complete to the fact that the peak power level is calculated over the full measurement period. This contrasts with the old threshold version where only the first “prefetch” measuring samples were downloaded for the calculation of a rough RMS value that was then compared to the set threshold level (in “g” units). By using this limited number of samples, impacts recorded later in the time series could be missed.
Threshold:
The red line in the histogram graph represents the set threshold level. If the blue bar level is above the threshold level, the complete measurement (1 measurement axis) will be downloaded from the sensor memory and sent wirelessly to the iQunet Server. A green indication will be shown at the top of the graph in this case. If the blue bar level is below the threshold level, the complete measurement will not be downloaded and will be discarded from sensor memory. In this case, there will be no indication at the top of the graph.
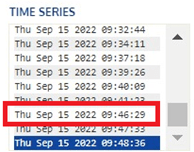
The timestamps of the blue bars (see figure below) refer to the timestamps of the measurements of which the peak power levels were calculated (i.e., the moment when these measurements were acquired by the sensor and stored into sensor memory). When the measurement (1 measurement axis) is above threshold level and is downloaded, the corresponding measurement timestamp will pop up in the “Time Series” box in the vibration lab (see figure below). In the case of multiple measurement axes, there will be a timestamp for each axis in the peak power histogram.

- Setting the threshold to “none” (default setting): the complete measurement will always be downloaded, even if the equipment is idle (the graph will show a full green line at the top).

- Setting the threshold to “30%” shows that in this example the last 50 measurements and all future measurements will still be downloaded completely (the graph will show a full green line at the top).

- Setting the threshold to “60%” shows how the last 50 measurements would have been downloaded for this example case (the graph will show green dots at the top for the downloaded measurements). The threshold level is now set accurately for future measurements.
- As from software version 1.9.6 on, the threshold can be set to “auto” meaning that the threshold level will be automatically calculated based on the last 50 measurements. The graph below shows which of the last 50 measurements would have been downloaded for this example case (the graph will show green dots at the top for the downloaded measurements).
Remark: iQunet advises NOT to use the “auto” setting when the machine is running continuously at a fixed speed since the automatic threshold is calculated by adding 10% of the peak-to-peak values to the lowest RMS value of the last 50 measurements. In the case of a continuously running machine, the latest 50 measurements will be similar to all previous and future measurements. If we set the threshold to be 10% higher than this normal operation, no measurement will ever be downloaded. In this case it is recommended to use the “none” threshold.
Remark: if there are no measurements available yet, it is difficult to set the correct threshold level. In this case, it is recommended to enable the automatic measurements, to set the desired capture interval and to leave the threshold set to “none”. Wait for enough measurements to be downloaded and fill the histogram graph before setting the threshold level.
Remark: to conserve battery power, it is important to set the threshold level to something higher than “none” to prevent full downloads when the DUT is not active. The result is that the battery lifetime may be extended since less data must be transmitted.
Number of retries:
The “Retry” setting in the “Download Filter” section represents the number of extra capture attempts after the set measurement interval (if the threshold level is not exceeded yet). For example, if the measurement interval is set to 30 minutes and the number of retries to “5x”, a first measurement will be acquired after the set 30 minutes. If the peak power bar level of that acquired measurement is below the threshold level, extra capture attempts will be performed every 6 minutes (5 within each measurement interval period) until one of the measurements has a power level above the set threshold level. That complete measurement will then be downloaded. After the complete download, a new capture attempt will only be performed after the set measurement interval of 30 minutes has elapsed.
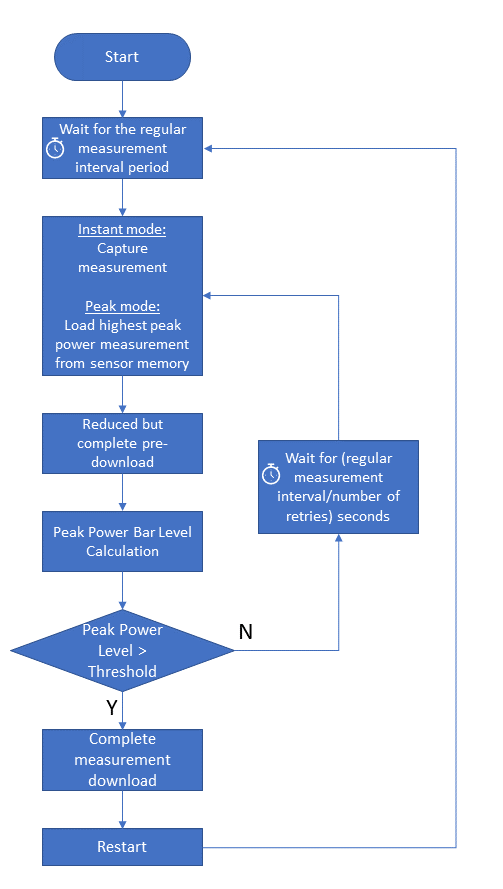
- If the capture mode is set to “Peak”, the measurement will always be downloaded at the end of the set measurement interval (if above threshold level). The sensor is measuring continuously but only saves the measurement with the highest recorded peak power during the set time interval (for example a time series triggered by an impact). This saved measurement will then be downloaded at the end of the measurement interval. You thus receive the “smart” event-triggered sensor data. Setting the number of retries higher than “1x” will only have value in some rare cases in this capture mode like for example in the case of a bad wireless connection.

- If the capture mode is set to “Instant”, the measurement is acquired and downloaded at the end of the set measurement interval (if above threshold level). You thus receive the “unsmart” purely time-based sensor data. If the number of retries is set to more than “1x”, the sensor will extend the measurement interval period with several retries (if the threshold level has not been exceeded yet) for acquiring for example a non-idle equipment measurement right after the interval period. If all retries are below the threshold level, the measurement interval period will be extended with more retries. If one of the retries is above the threshold level, that complete measurement will be downloaded. After the succeeded download, the next measurement attempt will only be started after the set measurement interval period has elapsed. The measurement scheduler thus uses the latest download as a reference point. The retry function allows us to acquire more non-idle measurements in case a machine is working intermittently.
![]()

Remark: “Peak” mode is only available for the cable powered sensors and not for the battery-powered sensors. For battery-powered sensors “Instant” is the default capture mode and therefore the capture mode selection box is not shown in the Sensor Dashboard.
Remark: using the retry function will off course consume more battery power than only taking 1 measurement per measurement interval, but battery consumption will be less than in the case of a short measurement interval where the measurements will always be downloaded idle or not.