
Power-quality sensor
Three-phase power and energy. LoRaWAN EU868.
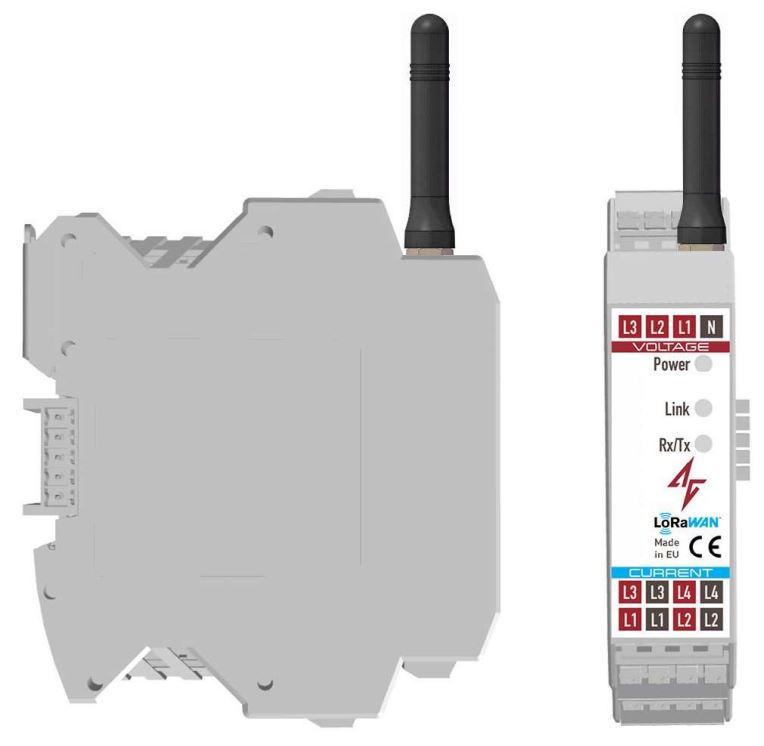
Understand the electrical load on your installation
Monitor voltage, current, power factor and energy use across three phases. The DIN-rail unit sends aggregated measurements to the M4, giving your team a history of electrical demand alongside other machine measurements.
- Installation
- Three phases + neutral · 400 V · 50 Hz
- Models
- 100 A, 250 A or 600 A
- Reporting
- Ten-minute measurement intervals
See your power data in action.
Follow electrical demand over time, compare the three phases and identify where a closer look could help.
Compare consumption
Use energy history to compare shifts, operating periods and changes to your equipment.
Check phase loading
Read voltage, current and power by phase to see how the load is shared.
Investigate power factor
Follow the relationship between active and apparent power, alongside the operating load.
Original iQunet demonstration with an earlier edge server. Play loads the video from YouTube.
Watch on YouTubeRead the power behind each phase.
The dashboard’s phasor view shows the power components for each phase. This original recording comes from the compressor-monitoring example.
What the letters mean
- P Active power
- Power converted into work and heat, shown in watts.
- Q Reactive power
- Power exchanged with electric and magnetic fields, shown in var.
- D Distortion component
- The dashboard’s calculated distortion-power component. The harmonic frequencies need a waveform measurement.
- S Apparent power
- The combined voltage and current demand, shown in volt-amperes.
The three colours distinguish L1, L2 and L3. Power-factor trends help identify conditions to investigate; a phasor alone does not locate the source of a problem.
Choose the current range for your installation
Each model includes three current sensors for a three-phase installation.
Ten-minute reports include voltage, RMS and peak current, power factor, power and energy for comparing demand and consumption across operating periods.
See how electrical demand changes
Compare the load across three phases and follow real and apparent power through the working day.
A compatible LoRaWAN interface receives the sensor reports. The M4 stores them locally and provides access from your browser and other systems.
Technical details
Request a quotation
Power-quality sensor
Include the installation’s current range and the number of circuits to monitor. We’ll specify the sensor set and LoRaWAN connection.