ModVibe 2.0

Dual vibration. Magnetic flux. Temperature.

Request a quotation
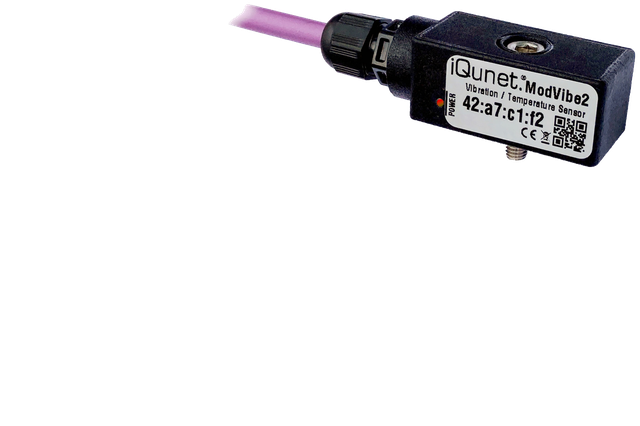
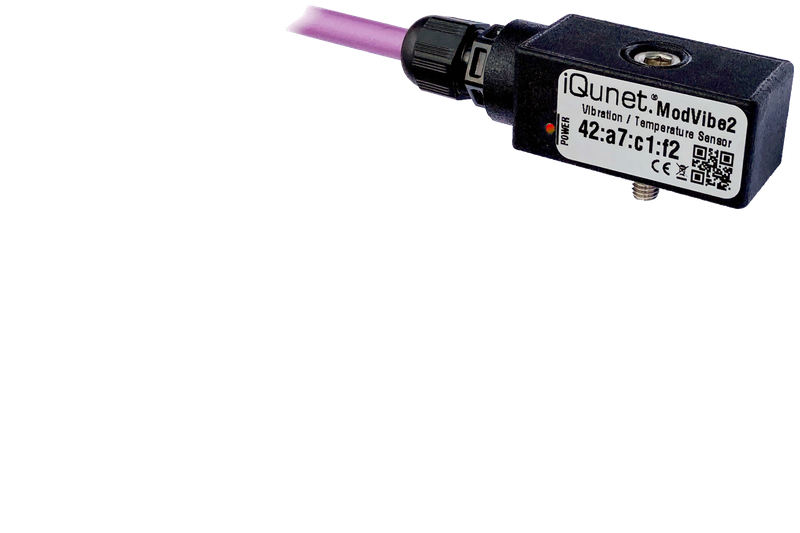
ModVibe 2.0 sensor with its fixed cable, mounting screw and original product label
Dual vibrationX · Y · ZTemperatureInternalMagnetic fieldB · µTIP67 / IP68Enclosure

Waveform capture and FFT analysis

ModVibe 2.0 is a Modbus RTU vibration sensor with waveform capture and onboard FFT. Inspect impacts and frequency components, then analyse the recorded samples in Vibration Expert or your own software.

Vibration
Two three-axis accelerometers in one enclosure
Low-noise (ADXL380) and wideband (ADXL382)
Up to 8,192 samples per axis
Magnetic flux
DRV425 single-axis fluxgate sensor
Up to 8,192 samples per recording
Connection
Modbus RTU · 24 V DC nominal

Two vibration sensors in one enclosure

Select a vibration sensor for each recording. Vibration (X, Y, Z) and magnetic field (B) are recorded synchronously.

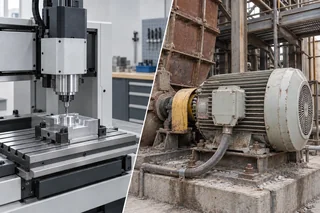
Illustrative split view of a compact precision milling machine and a dust-covered industrial motor in a worn heavy-industry installation, separated diagonally.
Sensor 1 · ADXL380

Low-noise

Small vibration signals

Investigate lower-level vibration and shaft-speed harmonics on precision machinery, motors and rollers.

Selectable range
±4, ±8 or ±16 g
Sensor bandwidth (−3 dB, typ.)
4 kHz at 8 kS/s
Sensor 2 · ADXL382

Wideband

Higher frequencies and acceleration

Investigate bearing impacts, gear-mesh components and pump cavitation across a wider frequency range.

Selectable range
±15, ±30 or ±60 g
Sensor bandwidth (−3 dB, typ.)
8 kHz at 16 kS/s

Motor magnetic field monitoring

In permanent-magnet motors, damaged or weakened rotor magnets change the leakage-field waveform and its harmonics. The onboard DRV425 records this field alongside vibration, so you can compare both signals with recordings from healthy operation.

VibrationXYZ
Magnetic fieldBµT
One recordingUp to 8,192 samples per channel

Modbus RTU and M4 gateway integration

Read ModVibe 2.0 directly over Modbus, or add local history and analysis with the M4.

ModVibe 2.0DC power + RS‑485
PythonDIY

Your own Modbus system

Read recorded waveforms over Modbus RTU using Python or your existing system. Store and analyse the measurements in your own software.

Fully integrated + Ready to use

With an iQunet M4

Store measurements locally on the M4 and analyse waveforms and FFT spectra in your browser. Connect software and AI tools through OPC UA, MQTT, GraphQL and OpenAI MCP.

Waveform analysis and reporting

With the M4, open recorded time-series data in Vibration Expert. Switch between the time waveform and FFT spectrum, compare recordings and export the underlying samples.

Vibration ExpertRecorded spectrum · X axis · 8,192 samples
Actual software view with stored demo-server data. 1,000 samples/s · 8.192-second recording.

Vibration Expert

Follow changes over time

Use historical waterfall plots to see when frequency components appear, shift or grow.

Ask for a weekly report

Connect ChatGPT or Codex directly to the M4 through OpenAI MCP. Ask questions about the recorded measurements and their history.

Example AI conversation

You ask
Which motors show new spectral components or increased peak amplitudes compared with last week? Compare spectra at similar operating conditions and report the frequencies and amplitude changes.
Example AI response

The shaft-speed component near 25 Hz is about 5.7× its previous amplitude.

Possible cause: rotor imbalance. Phase and directional measurements would help confirm the cause.

Recorded vibration spectra with added modelled ADXL380 noise: Week x above, Week x+1 below, on matching scales.

Real-time FFT and spectrogram

ModVibe 2.0 calculates FFT spectra continuously on the sensor. View vibration or magnetic-field frequencies as they change, with a spectrogram showing their recent history.

Measured frequency sweep · ADXL380 · X axisEnlarge view

Technical details

ModVibe 2.0

Technical details

Measurement specifications

Choose the low-noise or wideband accelerometer for the signal you need to capture.

ADXL380

Low-noise measurements

For lower-range measurements and machinery where small vibration changes matter. Investigate shaft-speed harmonics on slow-running motors, rollers and conveyors.

Selectable range
±4, ±8 or ±16 g
Raw output rate
8 kS/s per axis
Sensor bandwidth (−3 dB, typ.)
4 kHz at 8 kS/s
FIR bandwidth (−3 dB)
≈1.45 kHz at 4 kS/s
Characterized noise density
26 µg/√Hz
ADXL382

Higher frequencies and acceleration

For higher acceleration levels and broader vibration content, including bearing impacts, gear-mesh behavior and pump cavitation measurements.

Selectable range
±15, ±30 or ±60 g
Raw output rate
16 kS/s per axis
Sensor bandwidth (−3 dB, typ.)
8 kHz at 16 kS/s
FIR bandwidth (−3 dB)
≈2.89 kHz at 8 kS/s
Characterized noise density
58 µg/√Hz

One accelerometer is selected for each capture; its X, Y and Z axes are recorded together. Raw output at 8 kS/s (ADXL380) or 16 kS/s (ADXL382) bypasses the firmware FIR. Sensor bandwidths of 4 kHz and 8 kHz are the component datasheets’ typical −3 dB corners in high-performance mode with default filters, not calibrated complete-device bandwidths. The typical equalized flatness bands extend below 3.8 kHz and 7.6 kHz respectively. The separate FIR −3 dB figures are calculated from the firmware coefficients at the stated lower output rates. Noise figures are characterized device values.

Match the capture to the machine

Select the sensing path, acceleration range, output rate and samples per axis. Lower rates allow longer observation windows; higher rates retain higher-frequency content. Choose enough range to avoid clipping the expected vibration peaks and gravity component.

Filtered output from 125 S/s

Supported vibration output rates are 125, 250, 500, 1,000, 2,000, 4,000 and 8,000 S/s on either sensing path, plus 16,000 S/s on the wideband path. Source-specific linear-phase FIR filtering precedes lower-rate decimation; each path’s full-rate output bypasses this FIR.

Keep the complete waveform

Select 64 to 8,192 samples per axis in the supported power-of-two steps. At 125 S/s, the maximum record spans about 65 seconds. Read the completed X, Y and Z record with its capture identity and configuration for subsequent analysis.

Check temperature and device health

Read the internal accelerometer temperatures alongside firmware health and capture status. Temperature follows the machine through the enclosure with thermal delay; it is not an instantaneous surface-temperature measurement.

The full vibration rate and filtering combinations above are defined for application firmware 1.03 and its version-specific register documentation. Older and newer firmware must be configured using the capabilities and documentation for that exact version.

Magnetic flux alongside vibration

Rotation-related components in the magnetic-field spectrum can be used to estimate motor speed. Identify the relevant component before converting its frequency to RPM; the electrical supply peak alone does not establish shaft speed. Keep mounting position and orientation consistent: F measures the field along one sensing axis.

Magnetic sensing
Onboard TI DRV425 single-axis fluxgate sensor
Measured quantity
Magnetic flux density B; F channel displayed in µT
Combined recording
X, Y and Z vibration plus F, with one capture identity and channel timing metadata
Record length
64 to 8,192 samples per channel in supported power-of-two steps
Stored flux output rates
125 to 8,000 S/s with ADXL380; up to 16,000 S/s with ADXL382
Digital flux passband
Up to 3 kHz at 8,000 S/s; 6 kHz at 16,000 S/s. Lower output rates have a passband of 45% of the selected rate.
Analysis views
Time waveform, spectrum, waterfall, history and export; live F spectrum and spectrogram where supported

Read the magnetic signal

Values in µT use nominal sensor and ADC scaling. They are not a calibrated magnetic-field accuracy specification. Shared capture timing identifies related records; calibrated phase accuracy between flux and vibration is not specified.

Compare like with like

Magnetic flux is a field measurement, not a direct current reading in amperes. Frequency markers and order references support investigation; automatic RPM estimation and automatic fault diagnosis are not provided by this feature.

The digital passband describes the implemented filtering, not a calibrated end-to-end frequency response.

Component and application references

TI DRV425 datasheet TI: Fluxgate for motor diagnostics

These references describe the component and its application. Their chip-level limits are not ModVibe 2.0 system specifications.

Mounting, power and connectivity

Sensor and rigid mounting point

The ModVibe2 sensor has a fixed 2 m cable and captive M6 mounting screw. Plan a flat, rigid measurement point with a tapped hole or a suitable bonded threaded pad.

DC supply and cable connection

Provide 12–30 V DC at the sensor, with 24 V nominal. Plan the RS‑485 wiring, common 0 V, grounding and termination using the installation reference.

Modbus client or iQunet system

Use an appropriate RS‑485 Modbus RTU client, or an iQunet gateway with a suitable RS‑485 interface. The gateway adds local measurement storage, browser analysis and interfaces to other systems.

  1. Mount on a rigid measurement point

    Use a clean, flat, rigid surface that transfers machine vibration into the mounting boss. The captive M6 × 1 screw can fit a tapped hole or a suitably bonded threaded mounting pad. Avoid flexible covers and unsupported brackets.

  2. Secure the sensor and cable

    The specified mounting torque is 1.4 N·m. Follow the complete datasheet for thread depth, seating and the scheduled torque recheck. Keep orientation consistent and support the cable with a relaxed service loop.

  3. Connect power and RS‑485

    The fixed cable carries supply and two-wire RS‑485. Use 12–30 V DC at the sensor, with 24 V nominal, and follow the documented grounding and termination arrangement. Power and RS‑485 share 0 V; the interface is not galvanically isolated.

  4. Configure and verify a recording

    Read device identity and supported firmware capabilities. Select the capture settings, start a recording, wait for completion and retrieve the waveform. Check the data and clipping before scheduling measurements or integrating it into an application.

Plan the RS‑485 bus

Analysis and data access

  • Time, spectrum and history

    In Vibration Expert, inspect recorded waveforms, frequency spectra and historical waterfall plots. Compare axes, use frequency markers and analysis controls, and export measurements for further work.

  • Live spectrum and spectrogram

    Supported sensor firmware and iQunet software provide a live line spectrum and rolling spectrogram for observing changes while the machine runs. Live display data is transient and distinct from stored waveform history.

  • Local storage and open data access

    The iQunet Edge Gateway stores recorded measurements locally and connects them to OPC UA, MQTT and GraphQL workflows. These are gateway capabilities; the sensor’s direct electrical interface is Modbus RTU.

Available views and acquisition modes depend on the connected device and software version. Live acceleration spectrum is documented in the qualified firmware 1.04 integration; do not assume an earlier device supports it without an update.

OpenAI MCP through the M4 gateway

Hardware and installation specifications

Vibration sensing
Two triaxial MEMS accelerometers; one selected per capture
Magnetic sensing
Onboard DRV425 fluxgate; one magnetic-field axis (F)
Output format
16-bit acceleration samples; magnetic channel F includes nominal conversion metadata
Input voltage
12–30 V DC at the sensor; 24 V nominal
Datasheet supply current
9–14 mA at 24 V, measured under the documented datasheet conditions
Operating temperature
−20°C to +80°C, ambient and mounting interface
Enclosure
IP67/IP68, complete factory-sealed device
Body dimensions
50 × 25 × 25 mm, excluding gland and cable
Overall length including gland
80 mm, excluding cable
Sensor body mass
50 g
Mounting
Captive M6 × 1 screw; 5 mm hex key; 1.4 N·m
Cable
Fixed 2 m PUR cable, approximately 6.9 mm diameter
Data connection
Two-wire half-duplex RS‑485, Modbus RTU, 8N1
Nominal baud rate
115,200 bit/s
Combined waveform transfer
Vibration and magnetic recordings use negotiated 460,800 bit/s transfer. The RS‑485 interface must support this rate.
Firmware maintenance
Integrated Modbus RTU bootloader; contact iQunet for the supported update procedure

Dimensions are nominal installation-planning values. The body height includes the mounting boss and excludes screw projection and tool clearance. Keep the factory cable gland intact and the free cable end dry or inside a suitable enclosure; IP67/IP68 does not establish resistance to pressure washing or chemicals.

Datasheet and integration references

Revision 1.3, issued 17 September 2026. Both PDFs document application firmware 1.03; match the firmware and contract versions to your device.

The PDFs below cover the documented vibration interface. For the newer magnetic channel, see the magnetic flux reference.

Read the complete datasheet online PDFModVibe 2.0 full datasheetRevision 1.3 · 21 pages · Includes register map and application note.PDFModVibe 2.0 Modbus referenceRevision 1.3 · 12 pages · Register map and application note only.
Are vibration and magnetic-field recordings synchronous?

X, Y and Z are acquired synchronously from the selected accelerometer. The magnetic-field waveform is recorded in the same capture, with its sample timing and filter delay retained. Phase accuracy between vibration and magnetic field is not calibrated.

How do sample rate and record length affect the FFT?

Recording duration is the sample count divided by the sample rate. With 8,192 samples, 1,000 S/s gives 8.192 seconds and approximately 0.122 Hz FFT bin spacing; 8,000 S/s gives 1.024 seconds and approximately 0.977 Hz bin spacing. Choose the sample rate for the frequency band you need, and a longer recording for finer bin spacing.

Request a quotation

ModVibe 2.0

Sensor with 2 m cable and captive M6 mounting screw.

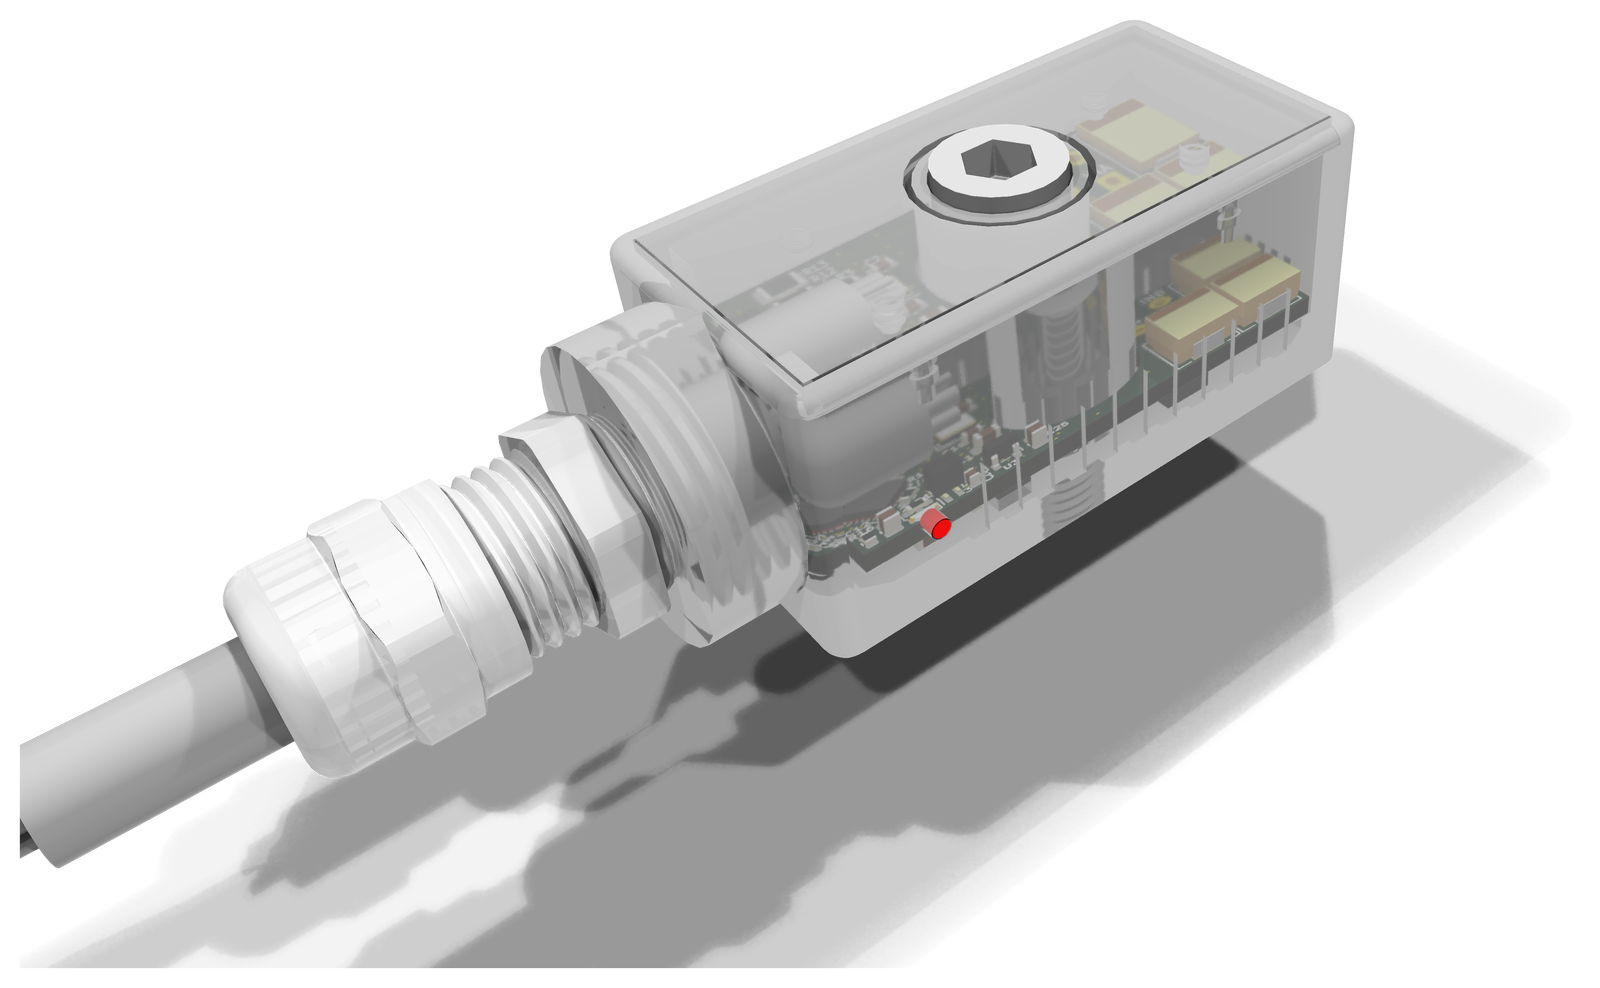
ModVibe 2.0 datasheet 3D render showing the internal sensor assembly

Price on requestAvailability confirmed with your quotation

No practical route for sensor cabling?Explore wireless vibration monitoring
iQunet · Engineering enquiries

Ask us a question

Ask about our products or pricing, request a demonstration, or get technical help.

About your question

About: ModVibe 2.0 vibration & magnetic flux sensor

Request type: General question
Prefer email or a call?info@iqunet.com+32 52 86 00 25

We use your details to answer this request. Privacy information (new tab)