
Connect on your local network
Open your gateway’s software, find your sensors and verify a first reading.
A browser is enough to get started.
The software runs on your gateway. Connect the gateway and your computer to the same permitted network, then open its local address.
Find your connection Working from another location? Remote access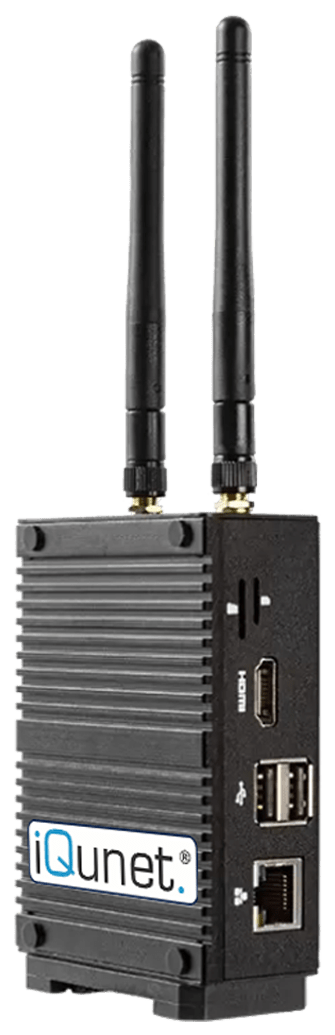 iQunet gatewaySoftware & measurements
1. Find your gateway on the network
Power the gateway according to its installation guide. Connect it to your router or switch with Ethernet, and connect your computer to the same network by cable or Wi-Fi.
Start with the gateway name
If you know your gateway’s hostname, add .local. For example, a gateway named SERN-dca6327b91e4 uses:
SERN-dca6327b91e4.localExample hostname. Replace it with your gateway’s name in the address helper below.
Or use the IPv4 address
Use the gateway’s IPv4 address from the installation record, or ask your network administrator to find it in the DHCP client list. Match the device or Ethernet MAC address.
A server ID from iQunet Connect is different from the local hostname or IP address.
No network available? See Wi-Fi & hotspot accessAlready connected through iQunet Connect?Open Home → Network, select the connected interface and read Current IPv4. Use the Wi-Fi interface’s address if that is your connection.
When does a .local name work?
Your computer must support local name discovery (mDNS), and the network must allow it. Guest Wi-Fi, isolated network segments and many VPNs can prevent discovery. If the name fails, use the IP address instead.
Remote access does not prove that your computer can reach the gateway locally. An empty Current IPv4 field means that interface has no address to use yet.
2. Open the software in your browser
Enter the local address in your browser’s address bar. Keep the http:// prefix and port number; a search-engine result is not your gateway.
Use the address from step 1. It is used only here to format the addresses below.
http://opc.tcp://Standard local ports are shown. Use the supplied endpoint if your installation has a custom port or access policy. This page does not connect to or scan your network.
Connected? Start with the task you need.
The current Home screen gives you direct access to device setup, monitoring and detailed vibration analysis.
- Find the device
Open Sensor Manager. Identify your sensor and check its last communication before interpreting a reading.
- See the measurements
Open Sensor Alarms for recorded values, trends and sensor status.
- Inspect a recording
Open Vibration Expert for supported vibration sensors. Select a recording to examine its waveform and spectrum.
Using an earlier software version?
Earlier Sensor Dashboard instructions use http://<gateway-ip>:8000/dashboard/app and the label Ethernet-802.3. Current software uses Home → Network. Follow the address supplied with your installation if its interface differs.
3. Verify a first value
The browser is the quickest starting point. OPC UA also lets your engineering tools read values directly from the gateway.
Check the value and its timestamp
A successful connection and a fresh measurement are different checks. Confirm the selected sensor, the reported value and when that value was recorded.
Battery-powered sensors sleep between scheduled measurements. An unchanged value does not necessarily mean the connection has failed.
Explore the measurement workflowConnect an OPC UA client
In UaExpert, add a server using the OPC UA address above. Use the endpoint and security settings approved for your installation.
Browse Objects and select your sensor’s macId. For supported vibration sensors, boardTemperature is a simple first value to inspect, alongside its status and source timestamp.
Good Source: 15 Sep 2026, 08:07:08 UTC
Try a read-only Python connection checkRunnable example · optional sensor reading
Read the server clock first
This check needs no sensor ID. It opens an OPC UA session, reads the server’s UTC clock and closes the session. It changes no settings.
Use Python 3.10 or later in a virtual environment. The example was tested with asyncua 2.0.1.
python -m pip install asyncua==2.0.1
python read_iqunet_local.py opc.tcp://GATEWAY:4840
Replace GATEWAY with the IPv4 address or .local hostname from step 1. The downloaded example starts with a standard anonymous session on the local endpoint. If your installation requires authentication or certificates, configure the client to match its approved policy.
Connected. Server status: Good
Server UTC: …
This confirms the OPC UA connection, not sensor freshness.
Then read a sensor temperature
Add --sensor YOUR_SENSOR_MAC using the macId from Sensor Manager. For sensors exposing boardTemperature, the script prints temperature in °C, quality status and source timestamp. The temperature is the sensor’s board reading, not automatically the machine bearing temperature.
"""Read-only local connection check. Python 3.10+; asyncua 2.0.1.

Install in a virtual environment: python -m pip install asyncua==2.0.1
Run: python read_iqunet_local.py opc.tcp://GATEWAY:4840
Optional: add --sensor YOUR_SENSOR_MAC to read its boardTemperature.
Use the endpoint and access policy approved for your installation.
"""
import argparse
import asyncio
from asyncua import Client, ua


async def read(endpoint, sensor=None):
    async with Client(endpoint, timeout=10) as client:
        # Standard OPC UA ServerStatus.CurrentTime node.
        clock = await client.get_node('i=2258').read_data_value()
        print('Connected. Server status:', clock.StatusCode.name)
        print('Server UTC:', clock.Value.Value.isoformat())
        if sensor:
            namespace = await client.get_namespace_index('http://www.iqunet.com')
            temperature = await client.nodes.objects.get_child([
                ua.QualifiedName(sensor, namespace),
                ua.QualifiedName('boardTemperature', namespace),
            ])
            value = await temperature.read_data_value()
            print('Temperature (deg C):', value.Value.Value)
            print('Status:', value.StatusCode.name)
            print('Source UTC:', value.SourceTimestamp)


if __name__ == '__main__':
    parser = argparse.ArgumentParser(description=__doc__)
    parser.add_argument('endpoint', help='Approved local opc.tcp endpoint')
    parser.add_argument('--sensor', help='Sensor macId shown in Sensor Manager')
    args = parser.parse_args()
    try:
        asyncio.run(read(args.endpoint, args.sensor))
    except (OSError, TimeoutError, ua.UaError, ValueError) as error:
        parser.exit(1, f'Read failed: {type(error).__name__}: {error}\n')
Client library documentation: asyncua minimal client
4. Keep access reliable
Keep a predictable address
For a managed network, ask IT about a DHCP reservation for the gateway’s Ethernet MAC address. That keeps the address assignment under their control.
When a static profile is required
Agree the address, subnet mask, gateway and DNS with IT first. In current software, open the Ethernet interface under Network and edit its IPv4 profile. Confirm the new address before ending the session.
The earlier software’s static layer-3 address can coexist with a DHCP lease. Do not assume that enabling a static profile removes every other address, and do not reuse the example address on this page.
Keep measurements on the gateway
Local browser access and storage do not require separate cloud data hosting. The embedded software accompanies the hardware; optional services and licences are separate.
If internet access stops, a powered gateway can continue local acquisition and storage while its sensor connections remain available. Losing the network path used by a sensor or your browser affects that connection. A network outage is not power backup.
If the connection does not work
The .local name does not open the gateway
Check the hostname and try the IPv4 address instead. If the interface has no address, check gateway power, the Ethernet cable and switch-port link. Confirm that the network supplies DHCP or that the agreed static profile is active. Use the connected interface’s Current IPv4 value, not the server ID, MAC address or router’s own address.
The browser times out or cannot reach the gateway
Recheck the local IP, the http:// prefix and port 8000. Ask IT whether client isolation, a VLAN boundary or a firewall blocks access from your computer. A reply to ping alone does not prove the web service is reachable.
Provide IT with the source computer, gateway address and required service: TCP 8000 for the standard local dashboard, or TCP 4840 for OPC UA. Use custom ports where your installation specifies them.
The dashboard opens, but no measurements are visible
In Sensor Manager, confirm the sensor identity, last communication and recording setup. Check its power, applicable radio interface or wired connection, and whether a recording has completed. Opening the dashboard proves browser access; it does not prove sensor acquisition.
The browser works, but Python or UaExpert cannot connect
Use the opc.tcp:// endpoint, not the web address. Check OPC UA service reachability, port and access policy separately. An iQunet Connect browser session does not expose a direct OPC UA tunnel to your computer.
Plan the connection around your installation.
Tell us which gateway or sensors you have, what you want to read and how your network is arranged. We’ll help define the setup.
Ask about your connection