
Monitoring & insights
Vibration analysis and condition monitoring software in your browser. Inspect recorded waveforms, FFT spectra and equipment alarms, with measurement history stored on your iQunet edge server.
Start with the machine. Follow the change.
Equipment status in one view
See your equipment, sensor connections and alarms together. Open a device to inspect the measurements behind its status.
- Set the measurement
- Choose supported sensor settings and recording intervals around the machine’s operating cycle.
- Follow the history
- Compare changes over time, then open the waveform or spectrum for a closer look.
- Keep the data available
- The edge server stores your measurements. Use its browser interface locally or through your installation’s remote connection.
From a trend to the underlying signal
Use Vibration Expert to investigate a recording in time and frequency, then compare it with earlier measurements.
Has a frequency component grown, or has the operating speed changed?
Use a comparable earlier recording to separate a change in the signal from a change in how the machine was running.
Compare the recordings
Choose the same axis and compatible settings, with similar speed and load where known. Check the waveform for impacts; use a waterfall or spectrogram to follow changes through history.
Locate the frequency
Use frequency markers to inspect a peak and its harmonics. With a known rotational frequency, relate components to shaft orders instead of assuming every moving peak is a new fault.
Inspect the surrounding peaks
Use sideband markers and a selected frequency band to examine spacing and amplitude around the component of interest. Interpret the pattern with the machine’s operating context.
The example shows stored vibration data; the dashed trace is the software’s modelled reference. Available analysis views depend on the sensor, recording and installed software.
Take the measurements further
Export recordings as CSV for your own calculations and reports. Earlier Sensor Dashboard releases also provide documented Google Sheets workflows.
Ask for the report you need
“Compare this week’s measurements with last week.”
Connect ChatGPT or Codex through OpenAI MCP. Discover sensors, retrieve current values and history, and use those measurements for comparisons, charts and reports.
The read-only connection returns selected measurements to your authorised AI workspace, with timestamps, quality codes and engineering units where available.
Explore reports with OpenAI MCPArrange the view around your equipment
Canvas Studio
Create custom dashboards with drag-and-drop widgets and live data. Add photographs or drawings, combine measurements and arrange multiple windows around the installation.
Embedded in the edge software. Earlier releases call this workspace iQunet Studio.
Bring the data into your existing systems
Connect to the SCADA you already use
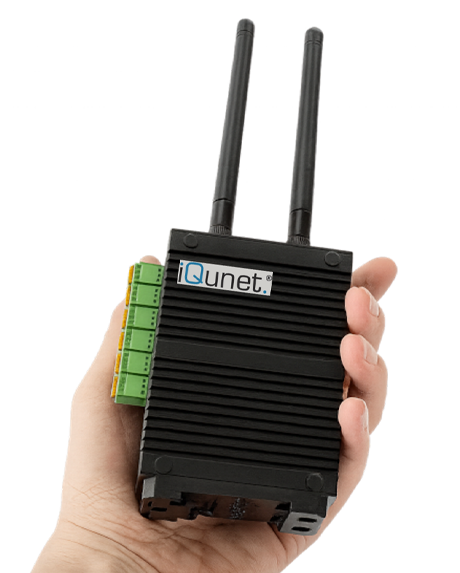
Bring condition measurements into the same operator view as machine speed, load and process state. Keep detailed recordings available on the M4 for investigation.
Selected vibration, temperature, valve-state or energy values from supported devices.
Speed, load and operating state through the plant’s configured connection.
Your existing SCADA
Its OPC UA client reads selected M4 measurements. Map them alongside the process tags your team already uses.
Ignition or a compatible FactoryTalk View SE setupSee machine condition together with its operating state.
Trend selected tags in the historian configured for your SCADA.
Start with the values operators need
For example: vibration RMS beside motor speed, or valve state beside a process step. Match timestamps, engineering units and update rates before using the tags together.
Plan detailed recordings separately
A full waveform contains an array of samples. Confirm the client’s data-type and history support before transferring recordings; use Vibration Expert on the M4 for waveform and spectrum analysis.
- Ignition
- Its OPC UA client can connect to the M4’s server and use selected measurements as tags.
- FactoryTalk View SE
- Use a compatible FactoryTalk Linx OPC UA Connector configuration. Confirm the installed versions and required components.
Plan the connection
Send your SCADA product and version, the measurements you need and the intended update rate. Include whether you need current values, history or recorded waveforms so we can check the data types and client support.
Agree the network route to the M4 with your OT team, including the endpoint, firewall access and the authentication and certificate settings supported by both systems. Confirm any SCADA components or licences required for your setup.
OPC UA
Browse the gateway’s measurement nodes and read current values or available history.
OPC UA accessMQTT
Publish monitoring data to your broker. Configure its connection and the measurements your applications receive.
MQTT workflowGraphQL
Query selected data and use supported operations through the API documented by your installed server.
API referenceFollow departures from the machine’s baseline
The optional Anomaly Detection Service compares new vibration or current measurements with patterns learned from your equipment.
Select representative history
Choose recordings that reflect the equipment’s operating behaviour.
Train for that equipment
On activation, selected data is compressed and transferred to iQunet’s machine-learning servers. The trained autoencoder model returns to your edge server.
Evaluate new recordings locally
Follow anomaly trends, set thresholds and inspect the associated waveform and spectrum. Inference runs on the edge server.
An anomaly marks a change from the learned pattern. Assess it alongside the operating conditions and the recorded signal.
Follow a real bearing-damage caseModel training and its licence are separate from standard software user rights. Discuss subscription or one-time purchase options and support for your installation.